Embrace view testing for stable and reliable GUI automation

Today, most of the web applications are Single Page Applications. In a nutshell, SPAs provide better customer experience where all the js, css, html are downloaded at one shot and based on the customer activity, screen gets updated dynamically. This approach provides enhanced user experience since the content loaded dynamically in the same page, page never gets reloaded and the user sees less of full white screen anymore. This is accomplished with the some of the modern client side javascript frameworks such AngularJs, ReactJs, Ember.js etc.

Since these frameworks have strong separation of concerns between View (presentation layer using html, js and css), Model (data that’s presented in the view using js) and Service (that fetches the data from the back-end using js), it gives us the advantage to test the presentation logic @ view level.

Stepping back to traditional applications, we didn’t have this separation as clear as its now, hence the test automation techniques had to stand out and test the whole GUI as a blackbox. Tools such as webdriver, QTP, Microsoft CodedUI etc help here, they have evolved over time and certainly paid of. But primarily they are targeted from outside in perspective, the adoption is never friction less.

Some common challenges that stand in the way towards true cross functional scrum teams

Blackbox – these technologies (webdriver, QTP etc) don’t play well with developer stack. Although webdriver has APIs in every possible language, still it’s not near and dear to the developer hearts. When they refactor the UI, leave test code behind and accumulate debt. Very common one and hard to overcome. I see this everyday.

  1. Cost of automation – related to the previous point, cost of maintenance seems high. Although the maintaining the test should be part of the story that caused the drift in the first place but practical acceptance of this is far from reality.
  2. Late feedback – everyone would love to get feedback as soon as the change is made part of the development process(in milliseconds). Blackbox testing requires the code to be checked in, built and deployed. Its not milliseconds for sure. You are lucky if its in minutes.
  3. Failure analysis – since these are end to end and from outside, failure cause could be anywhere in the stack and test failure report wouldn’t give you any of that insight.
  4. Confidence level – this is possibly the outcome of all the above and many more challenges. At the end of the day, developer wouldn’t feel the necessity of browser driven tests due to high cost low return factor.

In attempt to make Quality part of developer life, I wanted to resolve these issues as much as possible, offer as much as tooling and guidance to solve these challenges.

View testing came in handy to address some of these but certainly not all. Its not replacement of e-e GUI tests but certainly could lower the burden of GUI tests and improve the developer culture, morale and confidence in test automation.

In essence, here is the guidance

view testing.png


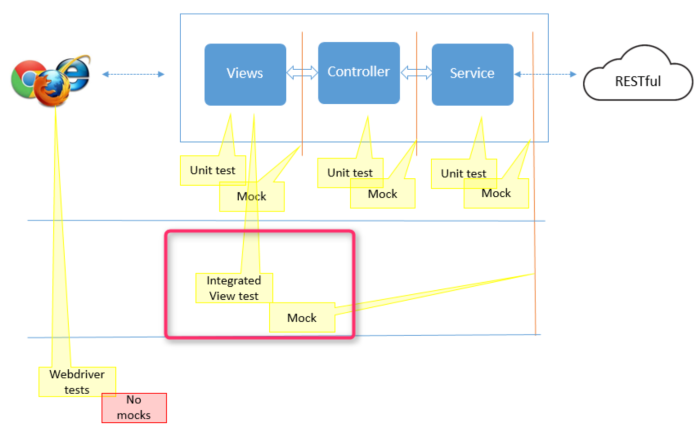
  • View tests – tests discrete components/directives for adequate combinations of props and states – JS driven, early feedback, near and dear to developer heart, easy to maintain, gives us most of the confidence. Inch wide, mile depth.
  • E-E GUI tests – tests multiple user journey, blackbox testing from outside – Webdriver driven, browser tests, late feedback, gives us the last mile confidence . Mile wide, inch depth

If this is something interesting, continue to read. I’m demonstrating this with a ReactJs  based application.

This is a simple Login component written in ReactJs.

Some of the behaviors we want to verify

  1. should render username input box with placeholder ‘something@email.com’
  2. should render password input box as type=”password”
  3. should render remember password checkbox
  4. should render remember password unchecked by default
  5. should toggle remember password when clicked
  6. should allow the user to key in username
  7. should clear username when cancel clicked
  8. should clear password when cancel clicked
  9. should NOT render any notification onload
  10. should render “WIP” while attempting to login
  11. should render “WIP” while attempting to login
  12. should render “SUCCESS” upon successful login
  13. should render “SUCCESS” upon successful login
  14. should render “ERROR” when login fails
  15. should render “ERROR” when login fails

Behaviors 1 thru 4 can be verified as unit tests since they are mostly view specific.

Traditionally, behaviors 5 thru 15 were tested thru GUI tests because they needed real browser for events simulation such as clicks, enter user, password etc. So, our goal is to see how to we can use the view testing guidance to test these behaviors.

Technology

  • Javascript – to create tests
  • Mocha  – as a test runner
  • JsDOM  – to mimic browser DOM in Nodejs
  • ReactJs, Flux – as a framework for dynamic web app

Setup

Clone the source code from here and install dependencies (npm install)

Tests are executed by running “npm run test”, that runs mocha. Since we are trying to mimic browser events, our component needs to be rendered inside DOM for us to perform certain actions such as button clicks, assert if correct class added to a node in the DOM tree etc. jsdom helps us with this.
This option in mocha.opts (–require ./src/components/__tests__/setup/setup) will make sure jsdom is loaded, global window and document is available before test execution.

Write tests

Now that we have the the setup, ready to write tests

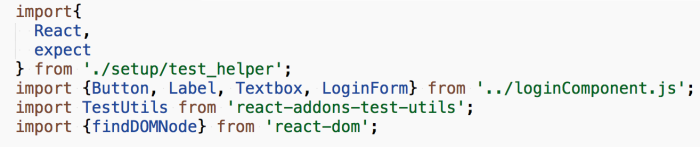
We need React, React TestUtils, our component and we could make use of react-dom apis to locate the elements in DOM tree.

React TestUtils will help render the component in jsdom. React-dom will help us to locate the elements from the DOM. React TestUtils got everything else to simulate events. Here is the list supported events.

Screen Shot 2016-03-13 at 7.57.13 PM.png

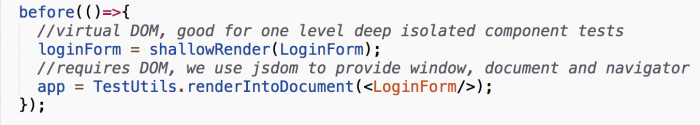
Before running any test, we are going to render the document into the DOM using ReactTestUtils renderIntoDocument.

Screen Shot 2016-03-13 at 8.04.08 PM.png

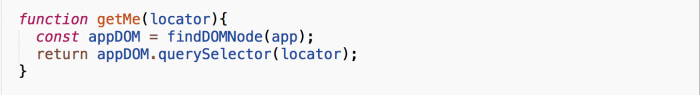
Now, react-dom provide nice wrappers around React to interact with DOM. We are using findDOMNode API to read values out of the DOM.

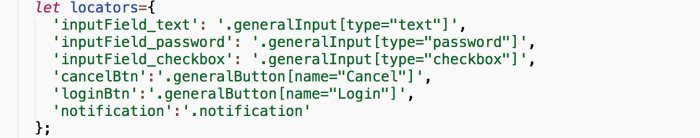
Here, I’ve defined all the locators in one place for easier maintenance and tests will ask for that element, element props and everything via this utility method getMe

Screen Shot 2016-03-13 at 8.21.55 PM.png

Screen Shot 2016-03-13 at 8.21.06 PM.png

With all the preparation done, ready to write tests. First 2 behaviors are written like this

Screen Shot 2016-03-13 at 8.24.46 PM.png

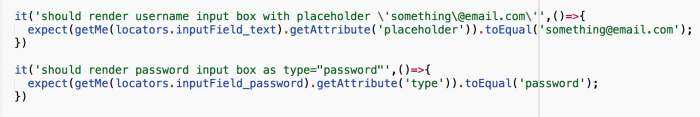
In essence, we are asking for that element from DOM and asserting certain attributes. This is pretty straightforward and usual unit test testing technique.

Next one, is the real fruit. Mimic browser events.

Screen Shot 2016-03-14 at 8.30.06 PM.png

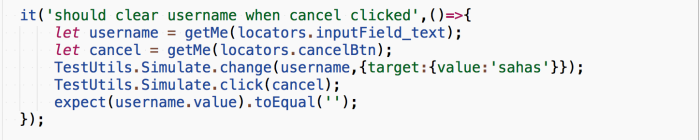
Here, in this test, we are asking for the elements form the DOM. Then using the Simulate api from React TestUtils to simulate the events.

Same way, we simulate actual login behavior as well. The fact here is we are not mocking the model or service.. when we simulate the login button click event goes thru the Flux architecture just like what would happen when user pushes the button on the app.

Screen Shot 2016-03-14 at 8.37.21 PM.png

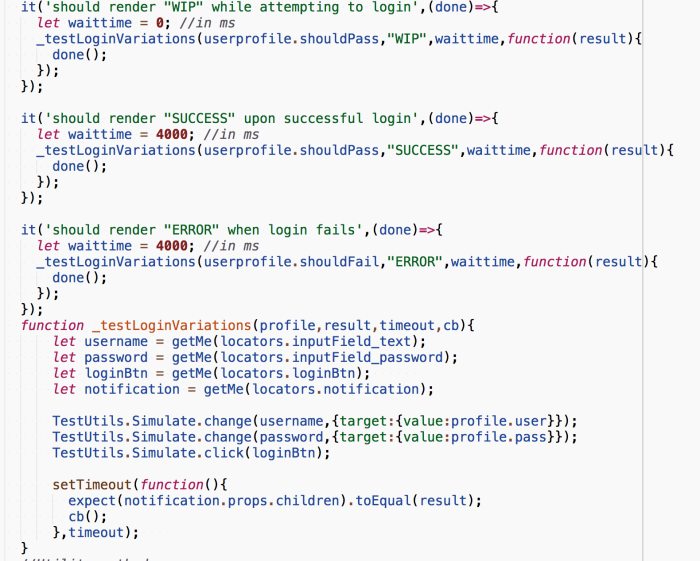
This is the speciality and value of this investment. we need not wait all the way to get the app deployed to verify these behaviors. In real world app, handling the timeouts could get get tricky but still manageable and maintainable. Feedback within seconds.

Screen Shot 2016-03-14 at 8.47.39 PM.png

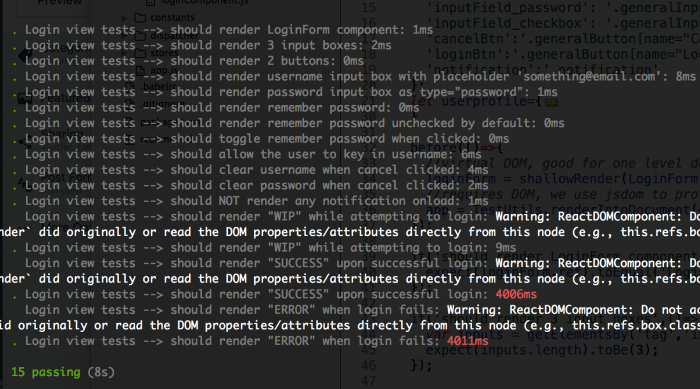
Certainly, this is not the alternate option for browser driven GUI tests, browser driven tests are needed to verify if the code still works on a given environment where we have greater influence of external factors and other integrating components. However, embracing  view testing will help in verifying a component/directive in depth to elevate test automation stability, developer confidence, bring in more developer participation and let the team own quality.

What about Angular?

So, a lot of this is React. What if you use something else like AngularJs? there is browserTrigger, something similar to React Test Utils simulate api.

Running selenium Grid using Docker + Kubernetes

Hopefully, these days more and more corporates are moving to SaaS based solutions (ie. Saucelabs and alike) for their test automation infrastructure. But for some reason, if you are running your own on-premise infrastructure using Selenium grid, continue to read.

Recently, I was doing a side project that was completely NodeJs stack for webapi, UI and everything. While I’m doing non-windows stuff, thought its wise to use Google Container Engine to host, run and maintain my containers. Part of this whole thing, I had to do little screen scrapping and can’t use something like Saucelabs. That’s where Gcloud and Kubernetes  came in very handy. Below is the setup..

Before we go too far, little bit Kubernetes 101 to set the context

Pod – group of one or more running containers.
Pod template –  describes the desired state of a single container. Desired state is important, coz, Kubernetes will use this description to make sure that the current state of the pod matches the desired state definition.
Volume – to persist the data across container lifecycle
Labels: key-value pair attached to each object in Kubernetes to group the resources together.
Replication Controller:  pod template + number of desired replicas = Replication controller.
Services: provide abstracted static IP address for pods selected by labels


Refer this get started with Google container engine, setup your cluster and node. I’m assuming that your node is setup and ready to go.

We are going to setup a Selenium hub and two selenium chrome nodes and configure them to talk to each other.

Selenium Grid hub setup

Hub Replication Controller – in essence, create a pod from the selenium-hub v2.50.0 image with ONE replication and expose port 4444 for tests to be queued.

Screen Shot 2016-02-21 at 9.28.53 PM.png

While this will start running the pods, there is no standard way to access this from outside. So, next 2 steps

Create Service

Screen Shot 2016-02-21 at 9.38.39 PM.png

Now, this will create a service but still not exposed to the Internet for you Queue the tests. So, run below command

Expose Service 

kubectl expose rc selenium-hub –name=selenium-hub-external —    labels=”app=selenium-hub,external=true” –type=“LoadBalancer”

Get services  – to get external IP, run below command

kubectl get services

You should see an output something similar (I’ve masked Cluster IP and External IPs)

Screen Shot 2016-02-21 at 9.42.15 PM.png

Test by hitting the external IP

http://IP:4444/grid/console

Selenium node-chrome setup

Goal is to setup 2 pods, expose port 5900 for selenium node <–> hub communication

Screen Shot 2016-02-21 at 9.54.01 PM.png

Now, if you go back to your grid console, you should see something like this

Screen Shot 2016-02-21 at 9.55.53 PM.png

Depending on your VMs capacity, you could replicate more agent pods to run tests. This works out fantastic for me and I hope this could save some money if you are still using on-premise selenium grid setup.

Perhaps, you could setup and tear down selenium-nodes on demand based on the requirements provided by your test suite instead of running agents 24/7.

All this source controlled here in Github

Integrate Taurus tests in CD pipeline

I’ve been using and sharing some thoughts about Taurus and how it enables developers to self drive Integration and Load testing in my previous posts.

Continuous Delivery/Continuous Deployment encourages maximum automation right from infrastructure provisioning thru monitoring so that small batches of code changes can go all the way thru in fastest possible cycle time and provide valuable + timely feedback to the team.

I’m recommending Taurus as an Integration testing tool and ways to reuse some of those Integration test scenarios for Load testing as well using Blazemeter cloud. Have a look at this short post on this. These tests need to run part of delivery pipeline –> post deployment process so that they can stop the build when test fails. To run Taurus tests part, you just need to install “bzt” runner on the deployment agents, ie. on Tfs build agents, if you use Tfs release management or Bamboo agents, if you use Bamboo deployment projects.

But there is a little trick to pass/fail the deployment.

  • If your deployment process supports parsing “junit xml” reports, you can directly let it parse the test result.
  • If your deployment process doesn’t support parsing “junit xml” reports, workaround is to use the pass/fail criteria from the “bzt” runner itself.

Below code shows how to achieve this. In essence, we use the passfail service and instructing bzt to fail the run, if there is any failure (succ<100%) and stop the execution. In this case bzt will return non-zero exit code (3) and the deployment tool shall use the exit code 3 to fail the test job and stop the build from getting promoted to the next stage.


Screen Shot 2016-02-19 at 7.48.38 PM.png

More detailed documentation is here

This snippet is in github for reference.


#perfmatters, run Taurus(Jmeter) tests on Blazameter cloud

In my previous posts, talked about running Taurus tests locally or on your on-premise Jmeter lab infrastructure. I wanted a way to run these Taurus load tests from the blazemeter cloud infrastructure for obvious reasons, started playing around with Blazemeter’s REST APIs and contacted them for some questions. They were kind enough to open up beta access to their cloud provisioning capability that they were working on at that time and now its public.

The final outcome is something great. From the test perspective, you will just describe your cloud vs local configurations. Bzt runner will take care of creating jmeter tests appropriately, upload them your cloud account, provision necessary infrastructure in different regions as per your configurations, run the test and publish the results to both local Taurus console output and Blazemeter as well.

This is pretty seamless and simple.

EDA4C38C-DF80-44B2-A85D-E8CF57AF34BA.png

In the above script, follow the stars, those are the configurations that you need ignorer to run your test on the blazemeter cloud.

  1. create an account in blazemeter cloud and get the API token
  2. determine locations to simulate virtual users for your test (see locations above, grab more locations from here)
  3. determine the load configurations, number of concurrent users, throughput, rampup time, holdup time, iterations etc

While running the test, supply this extra switch -o provisioning = cloud

If the test is executed without -o switch, bzt will take local settings and use your local resources.

Of course it needs more thoughtful work to mimic real user load pattern from production but this capability is very useful for developers to get started, listen to the feedback and fine tune the code instead of waiting for another external performance testing team. More documentation here.

Road to better and true agile development, encourage #perfmatters, close to true doneness when the story is done and less leftover techdebts.


Integration Testing using TAURUS (JMeter)

Regardless of the nature of app that we are building, regardless of the architecture and tech landscape, a fact about GUI\browser tests that almost every developer would point out is that GUI tests are brittle, slow, non-deterministic on and on and on..

Test automation pyramid is well known across the community and Integration testing at the API level is a great rescue vehicle in many ways. Unit tests are great and provides fastest possible feedback on code change. However, the trade-off is that true unit tests are mocked and any feedback that if offers excludes possible contract changes and broken integration. When we deploy new bits, you dont want your users to be the first testers, how would you verify the integrations in the most efficient fashion. With this intention, I’ve been using various specialty tools, some of the unit testing testing frameworks in the past but sadly none of them offer organic adoption amongst the developers in cross functional agile teams.

Recently, explored Taurus for load and performance testing. Here is my previous post talking about why Taurus could be a great contender on the stage.

For example, lets take a use case. I’m working on a story that’s related to stock symbol search indexing in google finance website. Change is in the backend indexing algorithm. Although is not directly related to the GUI however my end user will see the impact in the GUI. My intention is to verify whether the search still returns the list of matching stocks from USA, Mexico and minimum 2 options before proceeding too far, like

Screen Shot 2016-02-18 at 8.47.47 PM.png

This can be verified from the GUI, however, to make it faster and possibly more reliable, trying to mimic what the UI does by directly calling the API would make more sense since our intention is not visibility or UX change related. Of course, we could use the unit testing frameworks and many other tools.

Lets see if Taurus can help here, my intention is to make this API call and assert whether data comes back with different exchanges, below script would do that

Screen Shot 2016-02-18 at 9.30.52 PM.png

One of the good and bad aspects of automation is the “cost” of automation. We pay more in maintenance vs creation. The care and feed when it fails, especially team is charging fast towards a deadline, its got to be easy to fix and maintain these tests. Quite honestly, this is where all other tools fail in my experience.

Taurus makes it easier in many ways.

  1. Its is narrative, readable and when we source control, go thru collaborative code process (pull requests) and keep up tests just like any other production code
  2. Got junit xml reporting that can be parsed by almost any tool and improve visibility
  3. Blazemeter reporting integration is a great plus to keep track of history, trend and see when it started failing
  4. It’ll generate artifacts that were used for test execution and errors.jtl is very useful for first hand analysisScreen Shot 2016-02-18 at 10.07.55 PM.png
  5. At any point, run with -gui option to pop up jmeter GUI and debug the test


Finally, important aspect of any test automation is in providing faster and reliable feedback. Test should fail when its supposed to fail and stop the build from getting promoted. Its fairly easy to integrate this with any CI/deployment tool like Tfs, Jenkins or Bamboo and pass fail the deployment based on the pass/fail criteria.

This is one of the ways to control overuse of GUI testing, give it a shot and enable accelerated development.


Try “Taurus” for narrative, readable and maintainable Load\Performance tests

One of the best aspects of BDD is that they are human friendly, plain english, narrative, easy for a human (developer) to translate his\her thought process into actions, represents end-user behavior and a living documentation. By reading the output of a BDD test execution, anyone can understand the quality at that moment and the coverage provided by those tests. Above and beyond it invites better collaboration between PO and developers to verify the acceptance criteria in an automated fashion. It helps the functional verification part of the lifecycle.

When we move beyond functional checks, Is there anything similar to convert load and performance acceptance criteria? Right now most of the tools are engineer\tester focused tools, record and playback based and GUI driven.

If not BDD, Taurus seems to solve some critical problems that exist in this space. Except Locust, python based load testing tool, most of the popular tools such as JMeter, Gatling, Tsung, Visual Studio load test are all GUI driven and very hard to get them working for distributed Agile teams where more than one person would want to contribute, bug fix, maintain. Not very easy to code review when another colleague changes the test and accept the pull request and much more troubles.

Taurus is pretty cool,

  • write load tests in plain english (yaml), although its not narrative compared to BDD, Taurus is definitely more readable.
  • source control and easy for code reviews
  • unified DSL to author the tests and more than once tool of choice to run the test (JMeter, Tsung, Gatling etc)
  • readable real time reporting
  • Integration with Blazemeter reporting services, user will see cool charts @ no cost..
  • platform independent.. has Python and Java dependency and can run on any platform where Python and Java can run

Here is a quick sneak peek

This is all you need to run a get request on bing.com

---
  scenarios:
    demo:
      requests:
        - url: "http://www.bing.com"
          method: GET

Here is how you can add load profile to it

  execution:
    concurrency: 100
    iterations: 100
    hold-for: 10m
    scenario: demo

Put this in one .yml file and you are all set to run a load test for 10 mins with 100 concurrent users 100 iterations..couldn’t get easier than this..

So, how to get started?

Visit this page for detailed instructions – http://gettaurus.org/docs/Installation/

Once you install BZT..lets write a simple first load test.

My intention is to create a load test to find 90% response time when 100 concurrent users hit this page http://finance.yahoo.com/q?s=aapl continuously for 5 mins

First, we’ll create the scenario. It needs scenarios top level node and requests underneath. Demo is the name of the scenario.

  scenarios:
    demo:
      store-cache: false
      requests:
        - url: "http://finance.yahoo.com/q?s=aapl"
          method: GET

Second, we’ll setup the load profile. “execution” is the root node that holds the load profile properties and scenario to run (demo).

  execution:
    concurrency: 100
    iterations: 100
    hold-for: 5m
    scenario: demo

Remaining steps below are all optional.
Taurus uses JMeter by default, however, you may instruct to choose something else as well. If that tool of choice doesn’t exist, BZT will download, install it for you and run the test.

  settings:
    default-executor: jmeter

Putting it together

---
  settings:
    default-executor: jmeter
  execution:
    concurrency: 2
    iterations: 2
    hold-for: 30s
    scenario: demo
  scenarios:
    demo:
      store-cache: false
      requests:
        - url: "http://finance.yahoo.com/q?s=aapl"
          method: GET

When you run the test, you should see something similar to below result (note: I reduced the load profile while running from my laptop)

Taurus 1

Depending on the platform you run the test, you might also see this cool report console as well.. its out of box

Taurus 2

Now the icing on the cake is its super easy to integrate this with Blazemeter reporting and distribute some pretty reports around..

  modules:
    blazemeter:
      token: e504c64.......
  reporting:
    - module: blazemeter
      report-name: Test run
      test: 25 user load 25 iterations for 5 mins
      project: demo

In the above code, you will have to key in your blazemeter API key.
Amend this to your existing test and run the test again..you will likely see some cool reports like below

Screen Shot 2015-10-20 at 8.06.08 PM

Screen Shot 2015-10-20 at 8.05.14 PM

You can download the logs from blazemeter report as well

Screen Shot 2015-10-20 at 8.07.44 PM

In addition to all this, your console output should leave you with a link to this .html report for distribution..

This whole process can get better but Taurus is awesome and made traditional JMeter load testing much easier.. I love it.

Build impactful Test Automation dashboards using ELK stack

In the previous post, I mentioned my one of thousand opinions to improve test automation visibility to succeed in Agile transformation. If you happen to like those dashboards, continue to read. In this post, I attempt to explain how those dashboards can be created for your use.

Technology

Technology behind that is ELK stack.

  • Elasticsearch to store the logs\test results.
  • Logstash to ship the logs from your test runner to Elasticsearch.
  • Kibana to dashboard the data.

Minimum design could look like this

Screen Shot 2015-09-15 at 7.29.50 PM

There are many references and video walkthru to standup the environment. May be a quick pointer here is Elasticsearch setup, Logstash setupKibana setup or may be docker container.

In addition to this, we’ll also use another Elasticsearch plugin. Marvel to directly talk to Elasticsearch via API. Here is more info and install guide.

Mapping

Now that the environment is up and running, first step is to define the mapping. For lack of better term, mapping might be something similar to db schema. In order to pivot data appropriately, we need to input data in a consistent pattern and mapping helps for that.

A simple mapping to begin with

Screen Shot 2015-09-15 at 8.11.15 PM

Few quick points about mapping

  • Index – something similar to the database
  • type – something similar to the table
  • Nested Object – to store array of objects inside an object
  • _timestamp – enabled to automatically index timestamp of the document
  • “index” : “not_analyzed” will indicate Elasticsearch not to analyze this field. Good example is that test case names potentially have multiple words in a sentence, ie. User login to the app from mobile… I dont want Elasticsearch to dismantle the sentence, tokenize the words instead I want to report the name as one sentence. In such case, I’d prefer not to analyze the field.

(There are best practices to create the index combined with date and create a one daily as Elasticsearch can do efficient search across the indices.. for simplicity, I’ve created an index with whatever is required for this attempt)

Here is the gist to create above index, you can simply run this from Marvel (for example, http://localhost:9200/_plugin/marvel/sense/index.html)

Publish data

Once the index is created, we’ll publish fake data using APIs. Because publishing real test execution data depends on lot of external factors such as Test cases, plugin\logic to parse your test results conforming mapping structure and logstash configuration to ship the data over to ELK. While logstash configuration might be one easy thing, other pieces have huge spectrum of variables. For example, tests might be written in Jasmine + Protractor or Specflow + C# or something in Java.. so, at this point, lets fake it until we make it.

Screen Shot 2015-09-15 at 9.06.47 PM

Gist – publish data

In the above picture, I push a sample data manually using DSL from marvel and right side is the acknowledgement showing this document is indexed.

If you run “GET quality/_search”, it’ll show up all the documents indexed. Use your favorite scripting language to publish fake data as much as you want.

Visualization

At this point, we have some data in Elasticsearch, lets see how to create some visualizations using Kibana.

Launch Kibana (http://localhost:5601/) and confirm some settings

Screen Shot 2015-09-15 at 9.16.56 PM

Add “quality” to defaultIndex and make sure _timestamp is in metaFields ..otherwise, no visualization would work.

Discover

First step is to identify the subset of data we want to visualize.. navigate to “Discover” tab, select required fields from available fields and Save the discovery

Discovery 1

Visualize

Create new visualization

Visualize 1

Select data source for visualization

Datasource

Construct the desired visualization. In this case, I want to display grids of data by timestamp. So its simply building spliting the rows as shown below..and save the visualization.Visualize 2

similarly, build couple of more visualization

more Visualizations

Dashboard

Finally, we can bring all the visualizations together in the dashboard.

Dashboard 1

Visualizations built so far might not be so interesting because there are many test execution plugins offer pie chart and other charts of test execution data.

Best part of using ELK stack is the power of filters that allows us to go back in time and see the trend and make use of the time series data.

Below I’m applying the time filter

power of filter

Here I can combine the time filter with another parameter of my choice. For example, I want to see only ‘failed’ test cases on ‘dev’ environment in last ‘1 week’

power of filter 2

It can help answering many more interesting questions.

Would it be nice if you can see the quality of your build that went to production 14 days back? how many regression cases passed\failed?

Would it be nice if you can correlate your application logs with load test logs and detect anomaly?

Would it be nice if you can go to a single pane of glass that shows Functional, Performance, Security, Regression test results of your application for a given period?

Endless possibilities. Elasticsearch offers rich RESTful APIs as well to build and visualize something that Kibana doesn’t support out of the box..

Improve Test Automation visibility to succeed in Agile Quality transformation

One of the main success factors of Agile software development is, it makes everything terribly visible. If you walk into the area of a development team that’s practicing Agile, its highly likely to see some burn down charts, visible dashboards, monitors showing backlog, sprint progress, blockers and of course list of Tech Debts that they currently work or want to knock down soon.

For Quality practices to be successful and to benefit the overall agility, visibility is one of the key success factors too. In another blog post, I would have mentioned about preparing your QA’s for Agile practices. Knocking down separate QA\Perf\Security teams is the first step towards building self-sufficient product team to deliver concept to cash. However, once the team is formed, it’s absolutely critical manage visibility of the backlog.

For example, below is the task out of a story including automation tasks and keep it very visible part of the backlog.

Screen Shot 2015-09-06 at 8.01.09 PM

  • Visibility is critical to make fellow team members aware of the tasks
  • Visibility will encourage them to pull the test automation tasks even though it might not be their speciality
  • Visibility will improve collaboration between developers and those who are trying to make transition from conventional QA role.
    • For example, one of the thumb rules in test automation is “DRY” tests. Don’t Repeat Yourself tests. It’s crucial to analyze each and every test that we plan automate and answer this one question. “Are we automating the right thing and by applying the right technique?” ..If something can be automated at the unit test level, that’ll offer much faster feedback, love and care from everyone. If something is already unit tested, should we repeat that again in another form of test such as Integration or GUI level surface tests?

Further more, if you practice Kanban, WIP limits could come handy when team attempts to commit more development tasks before completing a story meeting DoD.

Once everything becomes part of the same backlog (remember no separate QA\Automation backlog), collaboration kicks in, its vital to elevate the visibility around the state of the union. Automated Tests should be part of the delivery pipeline and highly visible to each and every team member across the globe. When tests run part of pipeline and failure stops the build from being promoted that’s going to gain more attention.

For example, below is snapshot of test execution dashboard.

2015-08-19_15h41_10

Little note about the tooling here, regardless of the frameworks in use, ie. Specflow + xunit or Jasmine tests or JMeter tests or Selenium tests, what not.. everything would offer a way to gather the test run logs and plot some sort of nice chart showing the results.

More interesting  visual could be a histogram showing the success\failure of tests over time so that the team gains confidence by seeing more success

2015-09-06_21h09_38

Time taken for each test run so that the team can analyze and go smart to shorten the execution time

2015-09-06_21h18_03

Flakiness index (sort of failure rate over time) that might help connecting some global event that affected my app even though there is no change on my side

2015-09-06_21h09_38

If we provide a way for easier test failure analysis without having to wait for the expert to come in from another side of the planet, something like test execution screen cast or log link from Saucelabs, Blazemeter, Visual studio online etc..

(more detailed logs in each line in the highlighted area below)

2015-08-19_15h41_10

If we start practicing some of these techniques, it’ll make the Agile Quality transition more visible and next step is to identify obstacles and make them visible and keep pushing forward.

Do Testers need to be Developers to support Continuous Delivery and Agility.. ?

In this blog post, I explained the need to prepare the traditional QA’s towards Agile and Continuous delivery teams. However, this one question will keep bubbling up for some more time until everyone accepts the transition.  So, what is the role of testers in Agile teams. Do testers need to become developers? Unless you are a startup, you likely have QAs around in the organization who have been providing Test Automation as a service, what do to with them now? and so on..

There are many books (Agile Testing, More Agile Testing) carry insightful discussion and experiences from experts on this subject. Whenever this topic comes up for discussion, I’d fall back to one of my favorite articles by Rob Lambert.

While that sounds more like a people and talent management concept, sounds like it makes whole lot of sense when you want to mature towards self organizing Agile teams who can deliver high quality working product in sustainable pace.

Why is that critical to have ‘T’ skilled testers part of the team?

First off all it fosters collaboration across the disciplines. Deep expertise in one area ensures that the team has an expert in that area. However, for the expert to communicate his/her point across, it requires basic understanding and broad knowledge in the areas other than their specialty.

A team member who has come from QA background has deep expertise to approach quality, test automation design patterns and practices. However, it’ll add value if that person can understand the development world to some degree. Basic understanding of web development (if relevant), ability to scan thru unit tests and understand what’s covered at that layer and how, basic database concepts, DevOps understanding etc.

Similarly team member who is passionate about development got deep development expertise, however, it’ll add value if that person can understand testing techniques, test automation practices to some extent.

Lets take this example, recently I came across this situation where we were automating some test cases for a single page application(SPA). Unlike a website, SPA takes longer time to load initially as it loads all the JavaScript code once and any further action in the UI will just get updated data from the backend to rerender parts of the screen. URL is less likely to change. There could be several actions in the same page, depending on the user actions there could be network activity to fetch new data and update the screen. Given the nature of the application, it promotes composition at the GUI level. Meaning, a page might contain several components and each of them might have its own lifecycle. Lets say the page we were automating composed of 2 different components and your test case needs both the components to be completely available before going forward with next step.

We started to automate with default webdriver timeout of 60 seconds. For example, its expected that Angular finished rendering and has no outstanding http requests within 60 seconds, otherwise, test will fail. This worked well for a few days. Suddenly, tests started failing and resolving this issue highlighted the need for ‘T’ skilled QA team members.

Approach 1

One way to solve the problem is to increase the timeout from 60 to 90 or add some dynamic thread sleep. Tests started passing but would occasionally fail. This justifies why developers don’t subscribe to GUI tests because of non-deterministic nature of this testing technique. Why did it pass with 60 sec timeout, why does it pass with 90 sec and why does it fail for no reason?

Approach 2

Took a pragmatic approach. Went ahead to see what changed in that component and why it started failing. Found out that component two introduced long-polling. Long-polling? yeah, they prefered using persistent or long lasting http connection between the client side component and their chat server. So, the root cause of the problem was if the test is waiting for all http connections to be resolved within 60 seconds and its not resolved due to long-polling. Regardless, if we simply extend the timeout or put some sleep(), issue will persist.

Perhaps, Approach 2 surfaced the real problem and lead further discussions on both sides. It needed a tester who can go below the GUI surface, understand how application code works and work with developers to find a long term fix. Classic ‘T’ skilled tester. Developers started thinking whether they should adopt timeout technique in the production code instead of long-polling or is there a better technique. Testing side of the house started thinking whether its realistic to expect all http calls to be finished or narrow down to the scope of a specific component that the automation needs. Ultimately healthier discussions between the team members rather than blaming each other.

On one hand it might feel like these practices attract generalizing specialists, running into the risk of diluting the strengths, instead of mastering one thing we tend to touch everything. But the idea should be use specialists’ strength to succeed in accelerated delivery cycle.

  • If a tester can evangelize quality practices in a manner that other fellow team members can support and follow, that’s a win-win for everyone.
  • Fosters better collaboration amongst the team members.
  • Promotes empathy for each other and mutual respect. Cooperation not competition.
  • Invites developers and other team members to step up and help when there is a need instead of saying ‘automation is not my thing’.
  • Enables everyone to think about improving quality and preventing bugs.

Consider building ‘T’ shaped skills for your teams..

At (the very) least, why would it make sense to automate your tests?

While there is a lot of attractions towards continuous deployments, deploying to production 37 times a day etc, still the area of “Test Automation” seems to gain less attention that what it deserves. Most places adopt Agile could possibly suffer with lack of drive and ownership on Quality/Test automation during the transition, especially when your QAs transitioning to be an Agile team member. From what I’ve seen, those QAs who adopt the change are likely to get attreacted more towards product development and other tasks and team might get to a point where no one evangelizes quality. Especially, those places with legacy product in the market, it’s much harder. Reasons may be many, our PO wants new features, we got deal with tech debt, lot of energy goes into support and bug fix, our developers hate test automation;its a QA thing, we found a new tool and want to try that out, no proper tooling guidance, integration and so on..but the impact will hit our face sooner than later. I’m collaborating with atleast 100 developers in regular basis and could notice ~ 5% of them talking about practices like BDD and TDD. Remainder of the crowd not necessarily hate automating their verifications, rather their professional passion and interest is not in test automation. After all, AngularJs got better future for developers than Selenium webdriver automation. However, delivering high quality working software needs quality checks and verification. If we were to align with the faster delivery cadence, release once in 2 weeks, those verifications need to be automated mindfully.

Automation has been there since ages, tooling space have evolved so much and plenty of reasons why automation makes sense. But still those don’t seem to motivate agile teams. If you are one of those team members who would prefer to pass on the automation task to someone else, pls continue to read. IMHO, at the very least, automated tests would help in below situations

Pull Request shivering

Geographically distributed teams can’t be avoided in software development. Even within the same team, team members are spread across the globe, nowadays we develop a lot of small components, libraries and put it out for consumption. Great example NPM carries 163,000+ packages, libraries and reusables. Micro services is a buzz word amongst many. These situations are driving us towards small, self-contained repositories of code base and potentially a lot of run time dependencies between them. When more than one developer need to collaborate, pull request (PR) has become a must have a thing.

  • does the pull request send shivers down your spine?
  • when a PR comes in, how confident are you to accept that code change?
  • how do you verify the code quality of the incoming PR? how would you verify whether it confirms to your coding standards and wouldn’t degrade your current code quality?
  • how do you verify that the new PR wouldn’t break current functionality?
  • naturally code base grows, multiple people contribute, is there anyway to know the current state of a given functionality?

Painful Releases

If it’s a small product, being developed by a few co-located developers, all the team members might stay in sync and might follow the same routine steps to verify releases. As product complexity increases, this will become a repeated time-consuming activity. When product grows, more people contribute, it’ll demand for manual procedures/documentation to make sure everyone checks the mission critical functionality the same way to certify. While human verification is valuable, we could delegate some error prone, multi step complex processes to the machine

  • is your post deployment verification process becoming a nightmare?
  • are you spending a lot of time to verify the deployment?
  • are you unsure that the new build didn’t break mission critical functionalities?
  • are you unsure that the new build didn’t degrade performance?
  • are you catching significant bugs after the release while they could have been fixed earlier?
  • do you notice inconsistency in verification process? every team member follows different steps?

If current level of automation is so low, you are likely to suffer from these symptoms. For some reason, if you are in this situation, it’s a great opportunity to showcase your technical leadership to up level your team. recipe is not that hard, couple of easy recommendations

Sonar Analysis, quality gates, attach quality metrics with Pull Request

Minimum, I would suggest to use SonarQube. Sonar is a flagship open source software that will add tremendous value to understand current code quality metrics and improve towards your target goal. Sonar can be used to analyze the codebase and provide various code quality feedback, can be integrated to most of the CI build systems to run code analysis upon check in, can be integrated with source control and be an indicator of code quality along with pull request. Example Sonar + Stash PR integration, very handy for code reviews.

Consider writing some tests (unit and/or integration tests) that can be executed part of the CI process. Sonar offers Quality Gates that can help enforcing standards, fail the CI build when desired level of code quality is not met.

Smoke Test Suite

The level of automation such as unit testing, api, gui doesn’t matter. Patterns and practices such as BDD, TDD, ATDD doesn’t matter. It makes complete sense to identify mission critical flows of your application and start developing smoke testing suite. If your app is e-commerce, search is a must have. checkout is a must have. I would at least build a smoke testing suite and work towards integrating that with the delivery pipeline. Shoot for high confidence, faster, repeatable and consistent releases.

With increased modularity and libraries sharing eco system, these would also help the consumer to consume your library with high confidence. I generally don’t pull down any library from github unless I see tests passing.